Dear Gator Financial Partners:
We are pleased to provide you with Gator Financial Partners, LLC’s (the “Fund” or “GFP”) 2024 2nd Quarter investor letter. This letter reviews the Fund’s 2024 Q2 investment performance and shares our current views on the investment opportunity in Growth Banks.
Review of 2024 Q2 Performance
During the 2nd quarter of 2024, the Fund was slightly positive and lagged the broader market but outperformed the Financials sector benchmark. Our long positions in Robinhood Markets (HOOD), Jackson Financial (JXN), First Citizens Bancshares (FCNCA), Barclays PLC (BCS), and SLM Corp (SLM) were the top contributors to the Fund’s performance. The largest detractors were long positions in Carlyle Group (CG), Banc of California (BANC), PayPal (PYPL), Customers Bancorp (CUBI), and Webster Financial (WBS).
|
2024 Q2 |
2024 Year-To-Date |
Total Return Since Inception 1 |
Annualized Return Since Inception 1 |
|
|
Gator Financial Partners, LLC 2 |
1.30% |
12.16% |
1,895.01% |
20.57% |
|
S&P 500 Total Return Index 3 |
4.28% |
15.29% |
486.13% |
11.69% |
|
S&P 1500 Financials Index 3 |
-2.12% |
9.32% |
256.89% |
8.28% |
|
Source: Gator Capital Management & Bloomberg |
|
1The Fund’s inception date was July 1, 2008. 2Performance presented assumes reinvestment of dividends, is net of fees, brokerage and other commissions, and other expenses an investor in the Fund would have paid. Past performance is not indicative of future results. Please see General Disclaimer on page 7. 3Performance presented assumes reinvestment of dividends. No fees or other expenses have been deducted. |
Comment About the Regional Bank Rally in July
Regional banks have had a strong rally in July. The Fund benefited from the rally. The tame Consumer Price Index report on July 11th sparked the rally. Then, the assassination attempt on Trump and Biden’s withdrawal from the Presidential race improved the prospects for a Republican Administration. Investors continued to buy Regional Banks with the prospect of a more favorable regulatory environment for banks. Regional banks have also benefitted from investors rotating out of large stocks into small-cap stocks.
Prior to the July rally, the negative positioning by other investors in Regional Banks had been extreme. The short interest in the S&P Regional Bank ETF (KRE) has been very high. In mid-June, the KRE had 50 million shares outstanding and 50 million shares short for a 100% Short Interest ratio. We believe some momentum-based and thematic investors were using the KRE as a large short position. When regional banks started to rally on the tame inflation report, these investors aggressively covered their short positions and drove the KRE higher. By mid-July, the shares outstanding of the KRE increased to 54 million and the short interest declined to 40 million, so the short interest declined to 74%. By July 26th, the shares outstanding of the KRE increased to 63 million shares. We still think regional banks are cheap compared to their history, we think the coming interest rate cuts will drive earnings higher, and we think credit is manageable. So, it will be interesting to see if the investors who had been shorting banks come back to short the regional banks again or move on to other opportunities. The extreme negative positioning in Regional Banks is not as extreme as it was in late June.
Growth Banks Within Regional Banks
In our Q1 Letter, we shared our investment thesis on Regional Banks. At the end of our investment discussion, we briefly mentioned three specific opportunities we saw within Regional Banks: Puerto Rican Banks, Growth Banks, and Small Banks with Unique Stories. In this section, we are going to expand on the opportunity we see within Growth Banks. During July, the stock prices of Regional Banks rallied strongly due to softer inflation, prospects of a more favorable regulatory environment, and better-than-expected earnings reports. Even as Regional Banks have rallied 20%, we still see potential in Growth Banks relative to other Regional Banks.
Growth Banks are a core theme in the Fund. When we think about the distribution of mid-sized publicly traded banks, some are well-run, some are not well-run, some grow by acquisition, and some grow through organic growth. There is a group of banks that grow through organic growth and have high returns on capital. They can reinvest that capital into faster organic loan growth relative to their peers. There are seven or eight banks with these characteristics, including Western Alliance (WAL), Pinnacle, and Axos. These banks grow faster than the rest of the industry. They have historically traded at a premium to the rest of the industry. The regional banking industry usually trades at 12x earnings, while Growth Banks historically trade at 15x earnings.
Currently, these Growth Banks trade along with the rest of the industry at 10x earnings, a discount to where regional banks have traded in recent history. We believe we will realize an excess return as the industry returns to its normal valuation range and as the Growth Banks regain their premium valuations.
We think these banks are conservatively run by management teams who are thoughtful and motivated.
These banks are more diversified than the banks that failed last year. Some investors are avoiding Growth Banks. These investors believe you should not own the fastest-growing banks if we are heading into a recession. We may or may not be heading into a recession. Other investors are staying away from these fast growers due to credit concerns. We are comfortable owning these fast-growing banks because we think their credit quality will be no worse than peers through the cycle. Regional Bank stock prices are beginning to mean-revert to their historical range. We believe Growth Banks are going to regain their premium valuation. While we wait for these things to happen, the Growth Banks will grow faster than other banks in the industry.
Our view on credit quality at banks is not as pessimistic as some other investors. We think office towers in major markets like New York, Chicago, and San Francisco will struggle for a while as old leases run off and companies do not renew their leases for the same amount of space. However, most of those credits are not on Regional Banks’ balance sheets. Most of the loans on large office towers in gateway cities are held in Commercial Mortgage-Backed Securities (“CMBS”), Collateralized Loan Obligations (“CLO”), or on the balance sheets of large banks, especially European and Asian banks. Credit quality is something that we watch closely, but we do not see it as a problem. The bank management teams we talk with are very transparent about their exposures and the portions of their loan books that are concerning. They also have begun to break out their real estate exposure by sector. Right now, we are comfortable with credit quality.
Why does this opportunity with Growth Banks exist? One reason is investors’ general apprehension about banks and non-bank lenders who grow quickly. Historically, fast-growing lenders have grown because they have loose underwriting criteria or they offer credit structures that are too favorable to the borrowers (e.g., large real estate loans without recourse or personal guarantees). Another reason investors may be shying away from Growth Banks in the current market is recent history. The three large bank failures last year were banks that would have been considered Growth Banks. Another reason to doubt Growth Banks is the current deposit funding environment makes deposit growth difficult and expensive. Some investors are fearful of a step-up in expenses, higher capital requirements, and higher liquidity requirements.
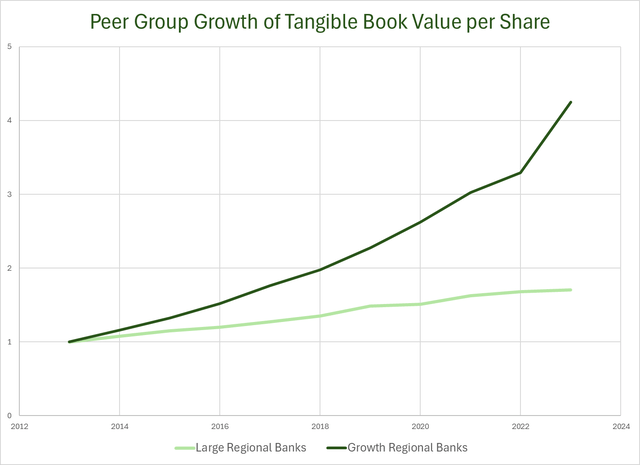
Growth Banks compound tangible book value per share at faster rates than other banks. They are not ballooning assets to make their balance sheets bigger. Instead, they are compounding their equity capital at a faster rate than peers. Many of the management teams at the Growth Banks publicly talk about their history of growing tangible book value. Usually, they have higher returns because they operate more efficiently than peers. The operational efficiency may come from a branch-lite operating strategy. Or, it may come because management works to cut out bureaucracy from the bank. Since banks need capital to grow their loan portfolios, Growth Banks with higher returns can reinvest into loan growth.
Here’s some data on how smaller, faster-growing banks can compound tangible book value faster than large regional banks. This graph shows the growth of tangible book value over the last ten years of a group of Growth Banks versus the large regional banks.

|
Source: Capital IQ Note Peer group for Large Regional Banks (USB, PNC, TFC, FITB, MTB, HBAN, RF, & KEY) Peer group for Growth Regional Banks (WAL, WTFC, PNFP, WBS, EWBC, FCNCA, AX, & UMBF) |
The opportunity we see in 2024 is atypical as Growth Banks currently trade at lower valuations than Large Regional Banks. Growth Banks trade at 10.2x 2025 Consensus Earnings per Share (“EPS”) estimates versus the Large Regional Banks at 11.0x 2025 EPS estimates. These Growth Banks trade at a discount despite faster book value growth than the large regional banks.
Portfolio Analysis
Largest Positions
Below are the Fund’s five largest common equity long positions. All data is as of June 30, 2024.
Long
First Citizens Bancshares
Robinhood Markets Inc.
SLM Corp.
UMB Financial Corp.
Jackson Financial Inc.
Sub-sector Weightings
Below is a table showing the Fund’s positioning within the Financials sector5 as of June 30, 2024.
|
Long |
Short |
Net |
|
|
Alt Asset Managers |
4.43% |
0.00% |
4.43% |
|
Capital Markets |
21.29% |
-4.60% |
16.69% |
|
Banks (large) |
12.60% |
-7.48% |
5.12% |
|
Banks (mid) |
42.10% |
-19.51% |
22.59% |
|
Banks (small) |
21.10% |
-5.08% |
16.02% |
|
P&C Insurance |
2.46% |
-6.13% |
-3.67% |
|
Life Insurance |
6.08% |
0.00% |
6.08% |
|
Non-bank lenders |
8.90% |
0.00% |
8.90% |
|
Processors |
4.13% |
0.00% |
4.13% |
|
Real Estate |
5.99% |
-10.32% |
-4.33% |
|
Exchanges |
0.00% |
0.00% |
0.00% |
|
Index Hedges |
0.00% |
0.00% |
0.00% |
|
Non-Financials |
0.00% |
0.00% |
0.00% |
|
Total |
129.08% |
-53.11% |
75.96% |
The Fund’s gross exposure is 182.19%, and its net exposure is 75.96%. From this table, we exclude fixedincome instruments such as preferred stock. Preferred stock positions account for an additional 17.27% of the portfolio.
Fund Closing to New Investors
We are closing the Fund to New Investors no later than December 31, 2024. As a private fund, we rely on the 3(c)1 securities exemption, which limits us to 99 investors. As of July 1st, we have 89 investors and regularly talk to prospective investors. We expect to fill our 99 investor slots before the end of the year. Once we close, we will begin a wait list, but we will only be able to accept new investors if one of our existing investors decides to redeem their investment in full. We will continue to take additional investments from existing investors.
Conclusion
Thank you for entrusting us with a portion of your wealth. We are grateful for you, our investors, who believe and trust in our strategy. On a personal level, Derek Pilecki, the Fund’s Portfolio Manager, continues to have more than 80% of his liquid net worth invested in the Fund.
As always, we welcome the opportunity to speak with you and discuss the Fund.
Sincerely,
Gator Capital Management, LLC
Read the full article here


