Apartment Investment and Management Company (AIV) is trading substantially below asset value and returning capital to shareholders via both stock buybacks and special dividends. It is a different sort of REIT, so let me begin with a discussion of its genesis through the Aimco split.
Specialized branches
Aimco was a long-standing apartment REIT that split into Apartment Income REIT (AIRC) and Apartment Investment and Management Company.
AIRC was since purchased by Blackstone (BX), leaving AIV as the remaining leg of the split.
Most REIT splits are to create pure plays. Perhaps a diversified REIT splits into an apartment REIT and an industrial REIT so as to allow investors to more cleanly invest in the property type of their choice. Others will split along the luxury spectrum, creating a trophy asset REIT and a more working-class property REIT.
The Aimco split was different. Cash flowing properties overwhelmingly went to AIRC while the development arm went to AIV. This makes AIV a rather unusual sort of REIT. Aimco was formerly a large cap (not by magnificent 7 standards, but large for a REIT) so AIV has the development capabilities of a large cap REIT, but concentrated in its $1.3B shell.
Quite a few REITs have development capabilities, but rarely are they as concentrated. As an almost purely development focused REIT, valuation for AIV looks quite a bit different.
Valuing a development REIT
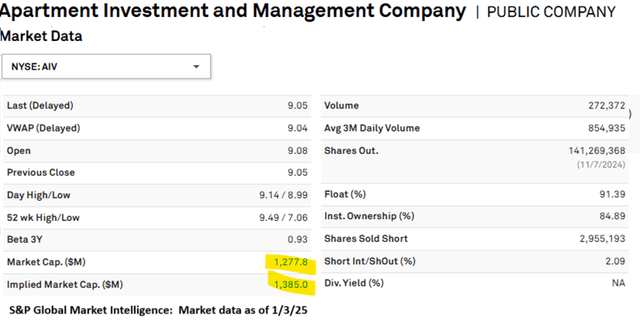
AFFO multiple is the primary valuation metric for most of the REIT universe. AIV has enough former developments that have stabilized and are still held to have positive FFO, but on this metric, it looks wildly expensive.
S&P Global Market Intelligence
A substantial portion of its assets are just in pre-cashflow stage, whether that be raw land being zoned for development or mid-construction properties in pre-lease.
As such, we will value it using a sum-of-the-parts net asset value (NAV) estimate.
NAV components and method
Below are AIV’s assets and the value we have ascribed to them:
2MC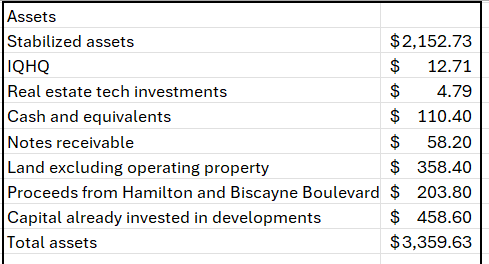
Stabilized assets are the most straightforward, and we valued those by applying a cap rate to annual NOI. In comparing the assets on location, quality and growth parameters, we landed on a 5.5% cap rate.
2MC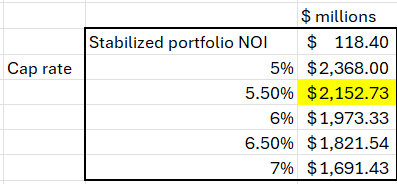
Apartments frequently transact in the 5% to 7% cap rate range, and we went slightly toward the higher NAV end (lower cap rate) for 2 reasons:
- Current rents appear to be below market, with rent as a percentage of household income sitting just below 20%. The majority of apartments are closer to 25%-30% rent as a percentage of household income, which suggests rent could be pushed up a bit.
- Growth is coming in stronger than national averages.
In its 3Q23 report, AIV upped guidance on same-store NOI.
AIV
As we detail more thoroughly in a recent apartment sector spotlight on Portfolio Income Solutions, 2024 was a rather challenging year for apartments due to the wave of new supply. Same-store NOI growth of 2.5%-3.75% in what could be the trough year is excellent.
Continuing with the NAV components:
IQHQ and real estate tech investments are minor components, so I just used the carrying value in AIV’s SEC filings.
More noteworthy NAV components to discuss are the land value and in-progress developments.
Land is listed on AIV’s balance sheet at $620 million. It has likely appreciated since purchase, but because GAAP accounting doesn’t adjust for appreciation, it sits on the balance sheet at cost.
AIV
However, this land includes the land associated with the stabilized cash flowing properties, so we have already valued some of it when we applied the cap rate to the NOI.
Excluding the land associated with operating properties, this figure drops to about $358 million (per the 10-Q). This would be the at-cost figure, and the appreciation will show up in later calculations as we value the developments.
AIV has projects in various stages of development. We have valued these in 2 different ways, which we will discuss below.
First, the facts as provided by AIV’s supplemental.
AIV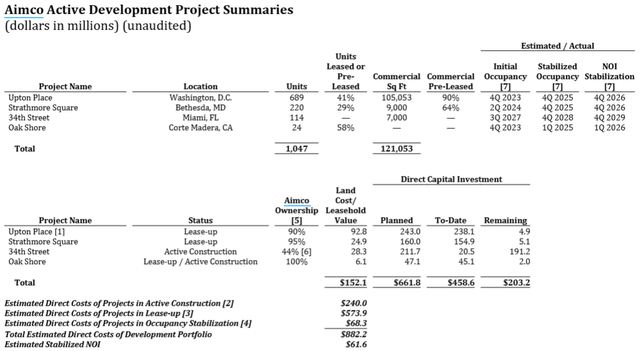
In total, that is $882 million of developments at a projected cap rate of 6.98% generating stabilized NOI of $61.6 million (company projection).
Brand-new properties in these submarkets would conservatively be worth a 5.5% cap rate, spotting the stabilized value of these assets at $1.12B.
2MC using data from company filings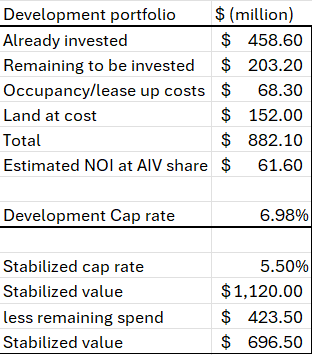
To get the assets to completion, AIV expects to spend an additional $423.5 million, so that takes the net stabilized value to $696.5 million.
All of these figures seem fairly normal to me. We have seen countless REITs develop at approximately 7% cap rates, so the projected 6.98% seems entirely reasonable. The roughly 150 basis point spread over stabilized cap rate is also quite typical, or even on the conservative end. 5% cap rate upon stabilization might be closer.
However, all of that value creation in the process of development assumes things go smoothly. So far, pre-leasing numbers look fine and construction/permitting seems to be progressing normally, but stabilization is scheduled for late 2026 and some of the pipeline as far out as 2029.
Given the unknowns of going that far into the future, I have instead elected to value the in-progress developments at the capital already invested ($458 million) for the purposes of the NAV.
The delta between $458 million and the $696.5 million stabilized value (at our assumed cap rate) represents potential profit margin if the developments are successful.
Most of the numbers in the NAV are as of 9/30/24 as the latest quarter in SEC filings. However, on December 19th, AIV announced the sale of 3333 Biscayne and The Hamilton for $204 million.
“DENVER, Dec. 19, 2024 /PRNewswire/ — Apartment Investment and Management Company (“Aimco”) (NYSE: AIV) announced today that it has successfully closed on the sale of its interest in two investments in the Edgewater neighborhood of Miami, Florida. Aimco’s investment in the development site at 3333 Biscayne Boulevard and The Hamiton were sold during the fourth quarter of 2024 for a gross price of $204 million. At the time of closing Aimco retired $110 million of debt, previously carrying a weighted average rate of 8.6%, and received net proceeds of approximately $90 million.”
This results in 2 entries into the NAV calculation.
- $203.8 million in assets (the proceeds of the sale)
- $110 million of debt (since paid off using the proceeds)
NOI from the sold assets is excluded from the $118.4 million used to value the operating portfolio.
In total, we measure asset value of $3.359 billion and liabilities of $1.598 billion, spotting equity value at $1.761 billion.
2MC using data from company filings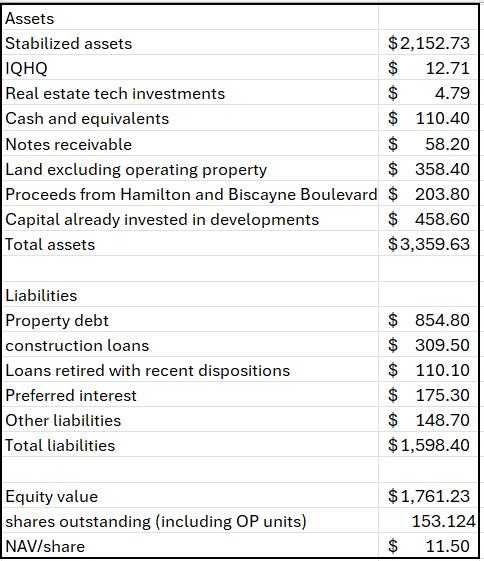
Divided over outstanding shares and OP units, we estimate AIV’s net asset value at $11.50 per share.
With AIV currently trading at $9.05, it has about 27% upside to NAV.
Realization of asset value
The median REIT is trading at 86.1% of NAV, so AIV is moderately more discounted. Discounts are not hard to find among REITs, the trickier part for investors is realizing the value.
For the more cash flow style of REITs, investors get to realize the discount over time via larger dividends than if they had paid full price.
Realization for a developer like AIV comes in a more sporadic form.
- Developments progress
- Stabilized properties are sold
- Profits from the round trip are distributed to investors
AIV seems to be aware of its discount to NAV and sees value in repurchasing its shares. Since its spin from Aimco, AIV has consistently been buying back its stock.
S&P Global Market Intelligence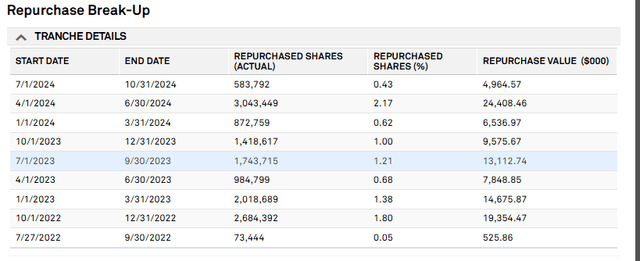
It is also using some of the profits from sales to finance a special dividend.
S&P Global Market Intelligence
$0.60 per share will be paid out to shareholders who hold on the ex-dividend date of 1/14/25.
That dividend payment alone is 6.6% of the market price, making it at least temporarily a high-yield stock.
Outlook
The cadence of future payouts and buybacks is a bit challenging to predict. It will depend on transaction markets, where cap rates move relative to development cap rates, and how well development properties lease up.
The company has had both hits and misses, which is typical of developers. By our estimation, the aforementioned Hamilton sale was roughly break-even. In contrast, the Brickell sale announced at the end of December 2024 was substantially profitable to the tune of $121 million (our calculation).
Data from company filings with calculations by 2MC
It is difficult to predict what the delivery environment will look like at the time of entering into a development, so we like to see well laddered timings to smooth out the peaks and troughs.
AIV has a significant slate of future projects in their pipeline with nicely laddered construction timing.
AIV
Note that the above document was furnished to the SEC before the sale of 3333 Biscayne completed, so that is of course no longer on their pipeline list.
Overall opportunity
The discount at which AIV trades provides a potentially strong return as developments progress. We are overall moderately bullish on the company.
Read the full article here
