A market hooked on a handful of mega-cap stocks is a precarious place to be.
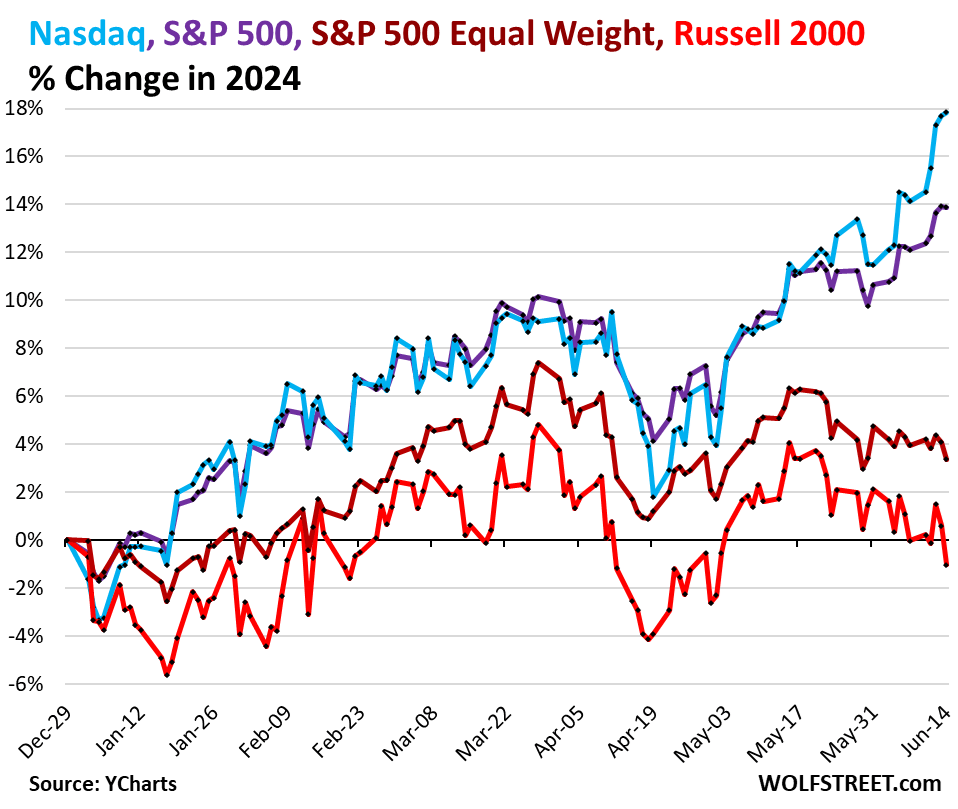
The Russell 2000, which tracks the smallest 2000 stocks in the Russel 3000, fell 1.6% on Friday, was in the red year-to-date, was back where it had first been in January 2021, and was down 18% from its all-time high in November 2021 (data via YCharts).
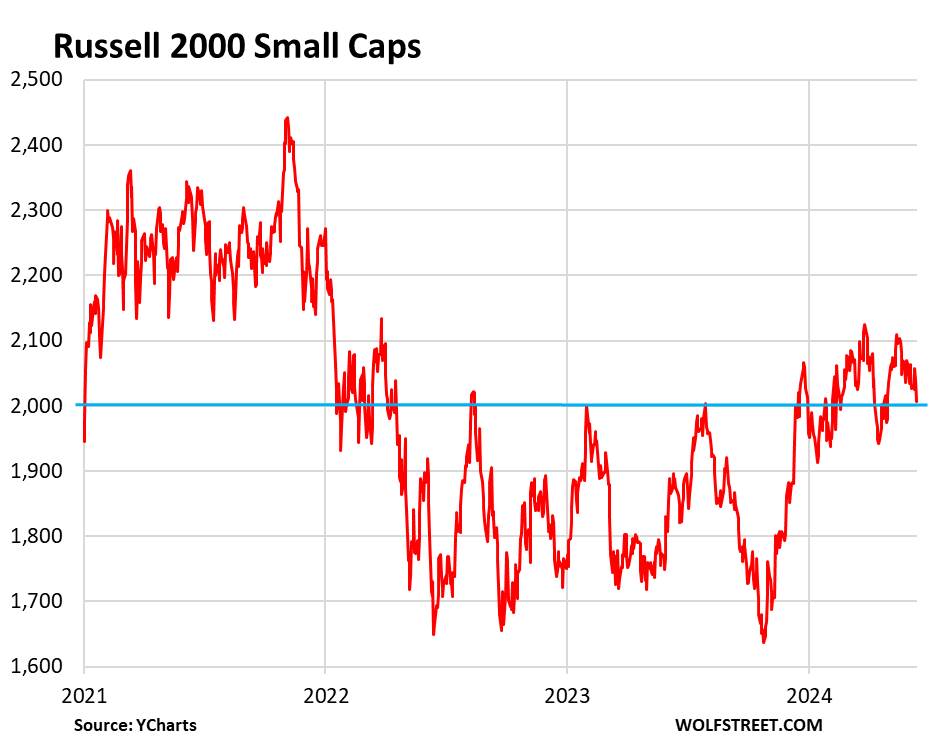
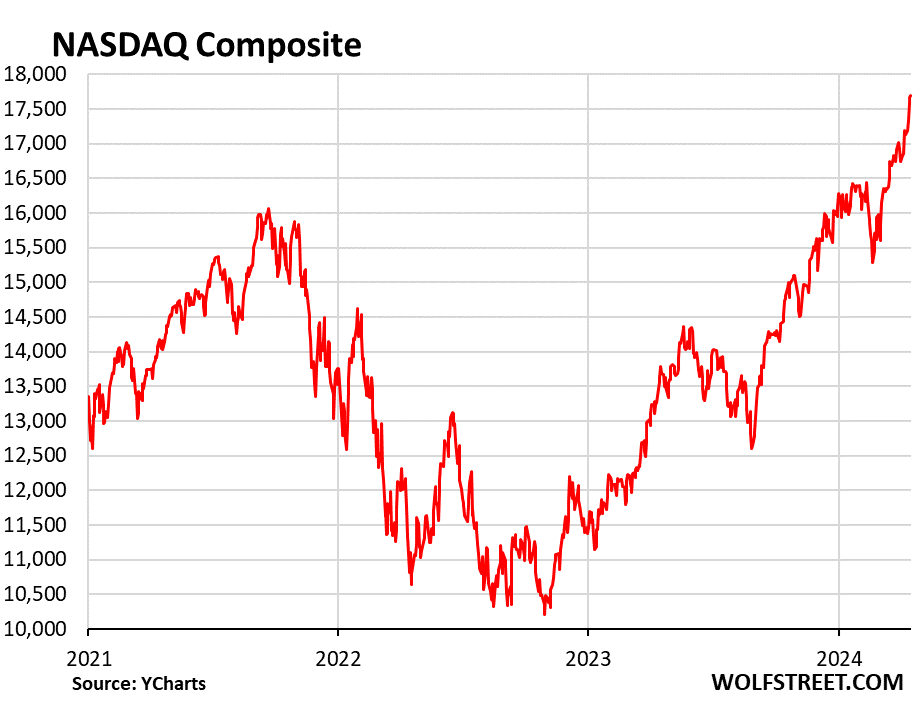
But the Nasdaq Composite eked out the fifth record close in a row on Friday, and was up 9.1% from its previous-cycle high in November 2021 – having surged by 73% from the big-trough low in December 2022. Just another day in a hyper-precarious stock market where the entire world has whipped a handful of huge multi-trillion dollar stocks into frenzy (all data here via YCharts).
The S&P 500 Index is now governed by a junta of three stocks with a combined market cap of nearly $10 trillion (Nvidia (NVDA), Apple (AAPL), and Microsoft (MSFT)) and another three stocks with a combined market cap of $5.4 trillion (Amazon (AMZN), Alphabet (GOOG, GOOGL), and Meta (META)). Those six stocks combined have a market cap of $15.2 trillion.
All of the 503 or so stocks in the S&P 500 combined have a market cap of about $45 trillion. Without those six stocks, the S&P 497 would have a market cap of $30 trillion. This entire market lives and dies by these six stocks. A fund that reflects the S&P 500 has a third of its holdings in just six stocks. Forget diversification?
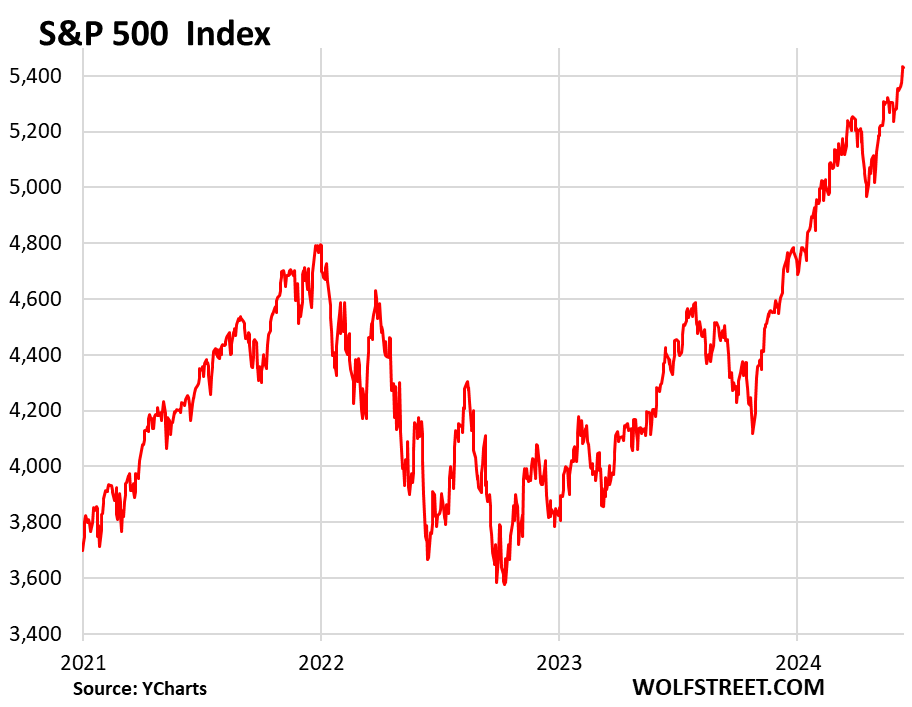
So the S&P 500 was just a hair in the red on Friday, and a hair off its all-time high, up by 13.3% from its previous-cycle high on January 3, 2022, with a big trough in between.
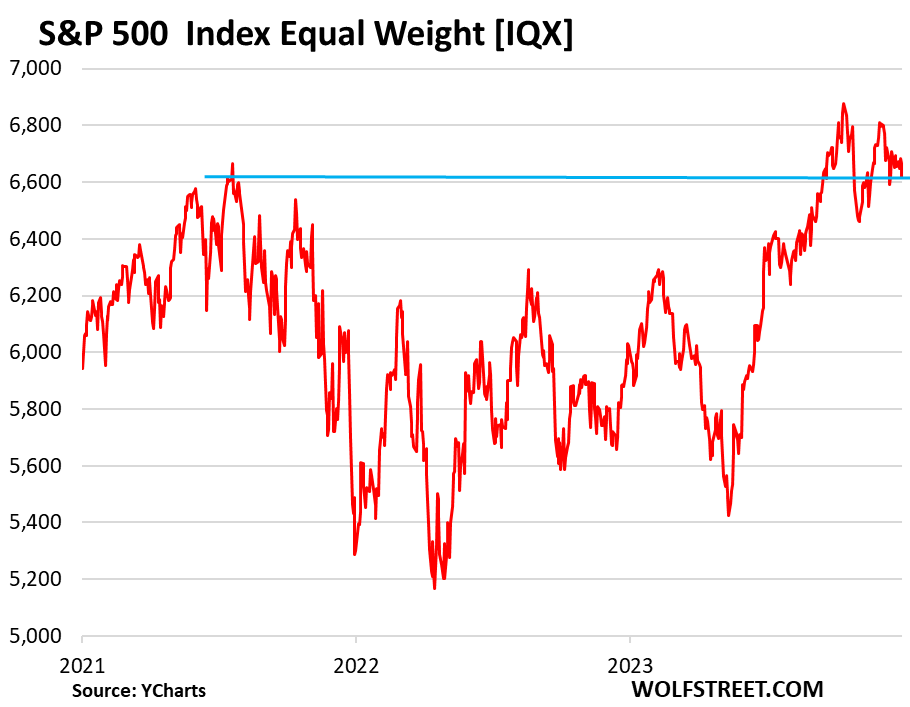
The S&P 500 Equal Weight index is not weighted by market capitalization. It contains the same stocks as the S&P 500 index, but all stocks weigh the same within the index. The purpose is to see if the performance of a small number of outliers with huge market capitalizations is driving the overall S&P 500 index and is in effect hiding what is happening to the rest of the market. And that’s the case.
The index fell 0.7% on Friday, is down 3.8% from its all-time high on March 28, and is right back where it had first been on January 4, 2022.
Year-to-date: For the year 2024 so far, the Russell 2000 (red) is down 1%; the S&P 500 Equal Weight (maroon) is up 3.4%, while the S&P 500 (purple) is up 13.9% and the Nasdaq Composite (light blue) is up 17.8%.
So that’s a very funny-looking split in the stock market:
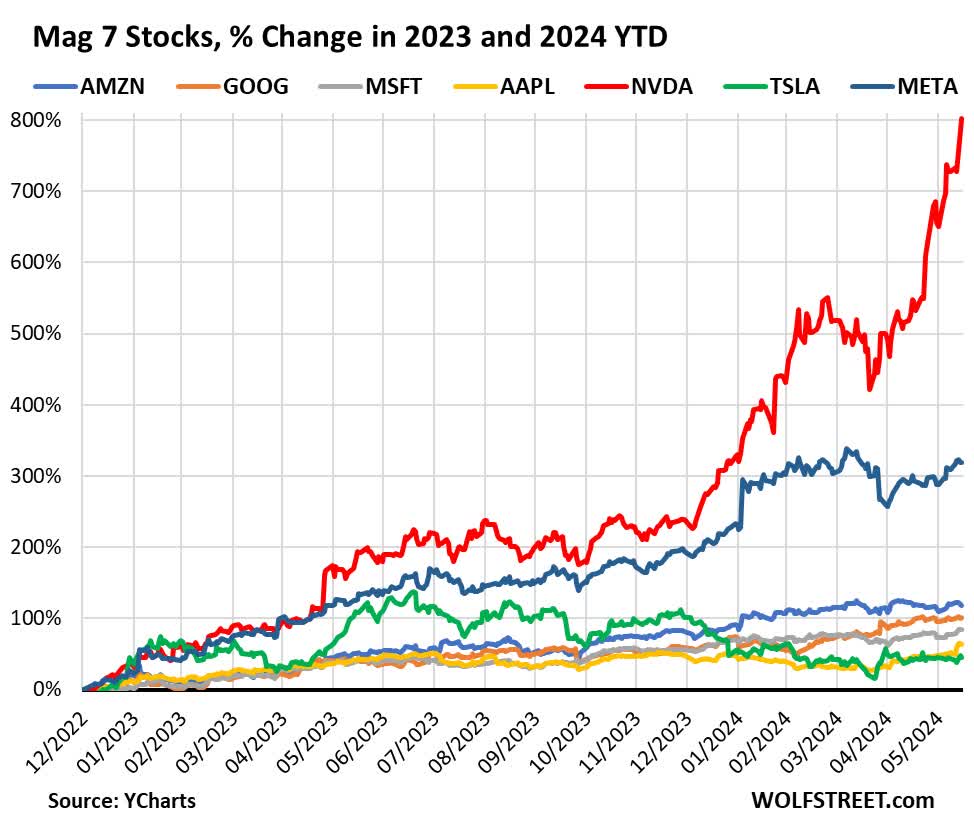
The Mag 7 is now a misnomer. Tesla (TSLA) fell out of the group. Its market cap plunged by 56% from its all-time high to $557 billion, less than half the market cap of Meta, which is the next smallest in line with a market cap of $1.28 trillion. But to revel in nostalgia, we’ll keep Tesla in the chart below (green).
What happened to Tesla – a 56% drop from the high, and a 75% drop at one point – can happen to any of the Mag 7.
In 2023 and year-to-date in 2024, Tesla is up 44%, still a massive increase in normal times, but that’s the smallest increase of the Mag 7.
The Mag 7, in 2023 and year-to-date in 2024:
- Nvidia: +802%
- Meta: +319%
- Amazon: +119%
- Alphabet: +101%
- Microsoft: +84.6%
- Apple: +64%
- Tesla: +44%.
Five of these Mag 7 are the biggest stocks in the universe in terms of market value. The entire world is now invested in them. They massively move the needle, and they move the needle even when the rest of the market is pulling against them. Having the big indices – and portfolios – hooked on just a handful of stocks is a very precarious place to be. But that’s what it is.
Original Post
Editor’s Note: The summary bullets for this article were chosen by Seeking Alpha editors.
Read the full article here


