By James Knightley

A tale of two surveys
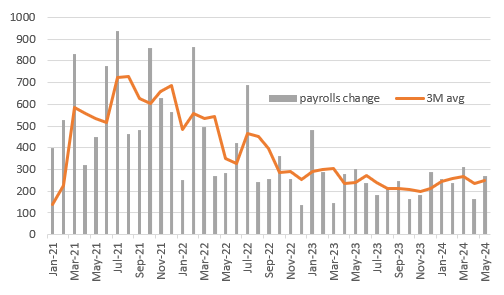
US May non-farm payrolls came in at 272k versus the 180k consensus and higher than any of the 77 forecasts submitted to Bloomberg – the range was 120-258k. Private payrolls rose 229k versus the 165k consensus expectation. There were 15k of downward revisions to the past 2 months for headline payrolls, but this is still an undeniably strong set of numbers that has seen market interest rate cut expectations reduce significantly.
The gains were once again led by the usual suspects of private education & health services (+86k), leisure & hospitality (+42k) and government (43k). Average hourly earnings rose 0.4%MoM/4.1%YoY versus 0.2/3.9% in April and also hotter than expected. This jump likely received a boost from recent minimum wage increases in California.
Change in non-farm payrolls (000s)
Source: Macrobond, ING
However, the jobs report is made up of two surveys. The Establishment survey of businesses gives us the payrolls’ number, but the household survey is conducted separately and is used to generate the unemployment rate. That hit 4% for the first time since January 2022 from 3.9% last month and a low of 3.4% in April 2023. Moreover, it reported households as saying employment actually fell 408,000 with unemployment rising 157k and the labour force shrinking 250k. This paints a much weaker picture.
There will remain some doubt over the non-farm payrolls number in light of the BLS’s Quarterly Census of Employment and Wages, which suggests payrolls are systematically overestimating monthly payroll growth due to the assumptions made on the births and deaths of small companies. Nonetheless, the number is the number until it changes, and the market has indeed focused on the payrolls and wage numbers, with Treasury yields jumping more than 10bp across the curve. That takes us back to roughly where we were this time last week.
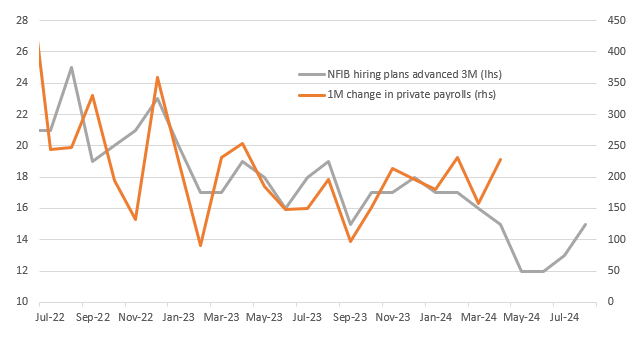
Non-farm payrolls are stronger than lead indicators suggested
Source: Macrobond, ING
Fed cuts delayed yet again
In terms of what this means for the Fed next week – well it confirms that the Fed will be pushing back rate cut projections from 3 cuts this year and 3 cuts next year to most probably 2 cuts this year and 4 next, but we can’t rule them out saying just one for this year. The market pricing for September has gone from 20bps down to 15bps, while cumulative easing by December has gone from 49bps to 40bps.
We are still looking for a September cut, but we need to see three things.
We need more evidence of inflation pressures easing. We have had a 0.2% on the Fed’s favoured measure of inflation, the core PCE deflator, and if we can get two or three more in quick succession that will be a necessary, but not a sufficient factor that leads to a rate cut.
We need to see more evidence of labour market slack. The unemployment rate has gone from 3.4% to 4%. If that moves convincingly above 4% with more evidence of a cooling of wages this too will help swing the argument in favour of rate cuts.
We need to see a softening of consumer spending, the primary growth engine in the US. There was some evidence of that in 1Q GDP revisions and weak April spending data, but the Fed needs to see more.
Content Disclaimer
This publication has been prepared by ING solely for information purposes irrespective of a particular user’s means, financial situation or investment objectives. The information does not constitute investment recommendation, and nor is it investment, legal or tax advice or an offer or solicitation to purchase or sell any financial instrument. Read more
Original Post
Read the full article here


