Housing is perhaps the most consequential category in the consumer price index, a key inflation barometer.
As the largest expense for an average U.S. household, shelter accounts for more than a third of the CPI weighting, the most of any other consumer good or service. That gives housing an outsized influence on the overall direction of inflation data.
Housing inflation has been stubbornly high for months, according to CPI data. But economists think it has peaked and is on the precipice of a reversal.
“I know this with about as high a degree of confidence as one could have,” Mark Zandi, chief economist at Moody’s Analytics, said of falling housing inflation being near at hand.
How ‘shelter’ prices have changed
Price changes in “shelter” were generally muted before the pandemic, economists said.
But Covid-19 warped that dynamic: Housing costs shot up but have slowed and even started to fall in some areas, economists said.
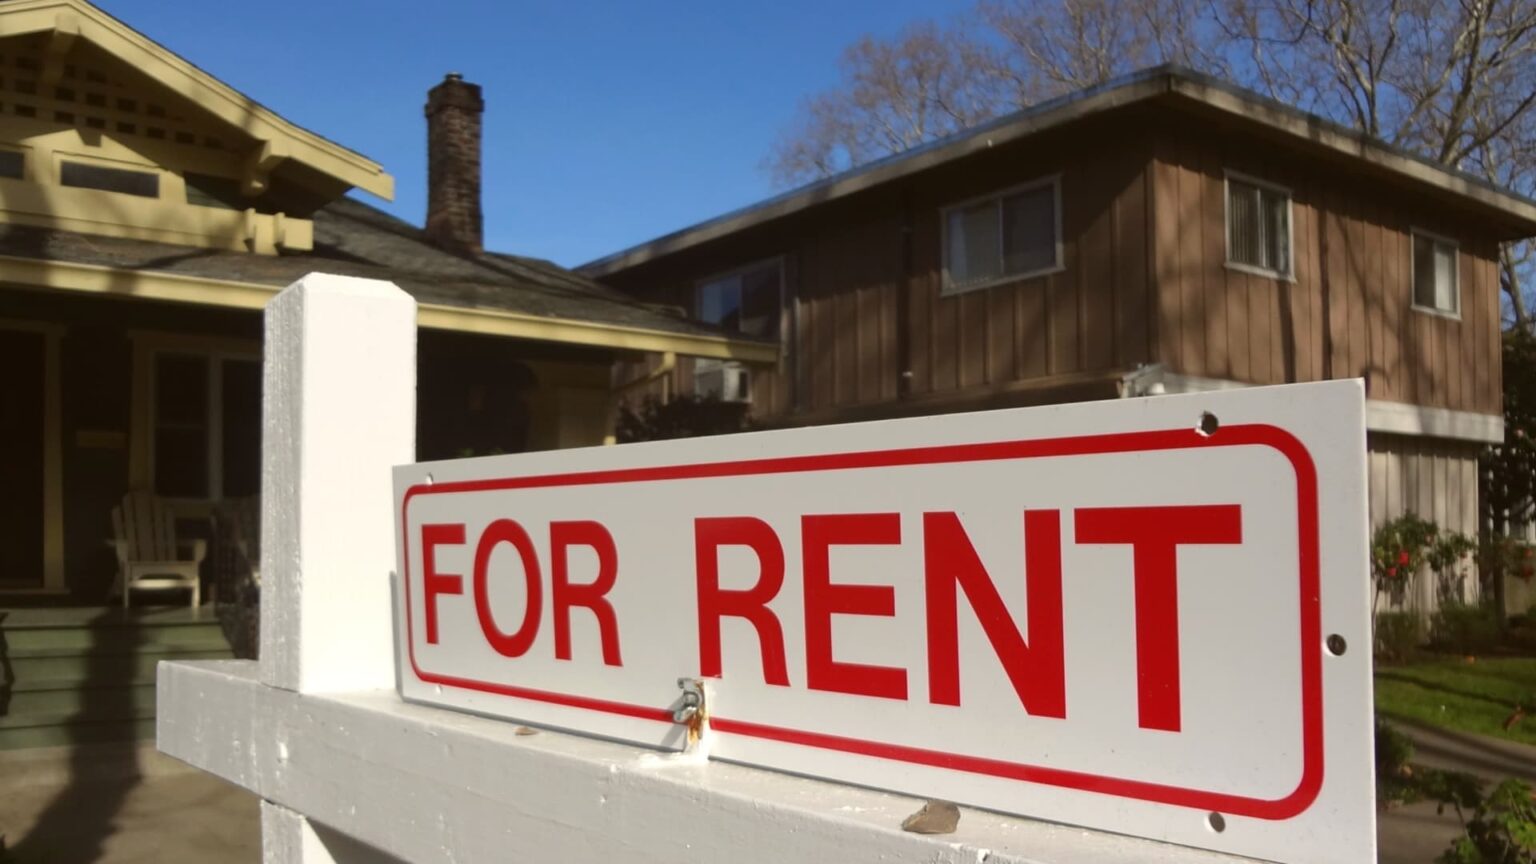
For example, Americans saw rents grow by 4.8% in May from a year earlier, to about $2,048 a month on average nationally, according to Zillow Observed Rent Index data. That’s a significant slowdown from 15.7% growth during the prior year, from May 2021 to May 2022.
CPI isn’t ‘a particularly accurate gauge’ for housing
Here’s the problem: The CPI doesn’t capture those price trends in real time.
It operates with a substantial lag, meaning it can take six months to a year for a decline (or increase) in current housing prices to fully feed through to inflation data, economists said.
“It’s not necessarily a particularly accurate gauge of what’s going on in the housing market right now,” Andrew Hunter, deputy chief U.S. economist at Capital Economics, previously told CNBC.
More from Personal Finance:
Social Security cost-of-living adjustment may be 2.7% in 2024
Here’s the inflation breakdown for May 2023, in one chart
The rich often misjudge the potency of their retirement savings
Here’s the reason for the lag: The U.S. Bureau of Labor Statistics collects rent data from sample households every six months. The BLS also divides these sample households into six different subgroups (called “panels”) and staggers when it collects data for each. Per the BLS, rents for Panel 1 are collected in January and July; Panel 2, in February and August, and so on.
That means it can take a year or so to collect data from all the subgroups.
Why economists think housing inflation is poised to fall
“Shelter is still playing a big role in inflation but that should be slowing in the second half of the year,” Jason Furman, an economist at Harvard University and former chair of the White House Council of Economic Advisers during the Obama administration, wrote Tuesday on Twitter.
The latest CPI reading, issued Tuesday, showed a monthly increase in shelter inflation, to 0.6% in May from 0.4% in April. The most recent figure is on par with the monthly figure notched a year earlier, in May 2022.
But a decline in CPI housing inflation is “almost as much of a certainty as you can get, really,” Hunter said.
There’s an additional measurement quirk relative to housing inflation: The BLS tries to assess price changes for homeowners as well as renters, in a subcategory called “owners’ equivalent rent.”
The measure is essentially a survey that reflects the price homeowners believe they could get if they were to rent their home.
While somewhat tied to market rents, homeowners aren’t necessarily feeling those inflationary pressures — especially those who have a fixed mortgage (meaning their monthly payment doesn’t change) or own their home (meaning they don’t have a housing payment), Zandi said.
Read the full article here


