In this article I outline how I will allocate the money in my retirement fund for the month of April. I will use the 10-month exponential moving average (EMA) and a relative strength ratio to determine where my money will go among four ETF choices: SPDR S&P 500 ETF (NYSEARCA:SPY) , Vanguard Extended Market Index Fund (VXF), iShares MSCI EAFE ETF (EFA) , and iShares Core U.S. Aggregate Bond ETF (AGG) . I have two objectives with this retirement account. The first objective is to make money, and the second objective is to outperform the SP 500 index. I want to achieve these objectives as simply as possible which is why I like to use the 10-month EMA crossover as my strategy. I look to be long the ETFs that are trading above the 10-month EMA and I look to be out of the ETFs that are trading below the 10-month EMA. It’s a simple strategy that allows me to stay in long term uptrends and keeps me out of long term downtrends avoiding massive drawdowns. This strategy is not guaranteed to work every time, but I don’t know of a strategy that does work every time. I use the relative strength ratios to determine which ETFs are the strongest as that’s where I want to allocate my money. Let’s get the current view of the market.
Chart 1: Monthly SPY with 10-Month EMA
www.stockcharts.com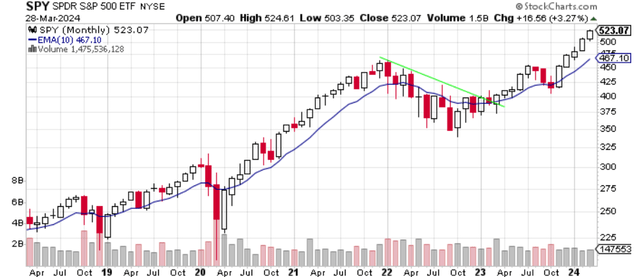
Looking at Chart 1 you can see that SPY continues to perform well. It was up 3.27% in March and made a new high. New highs are bullish. SPY is in bullish alignment. This is my term for a stock, ETF, or index that is above its upward sloping 10-month EMA as seen in Chart 1. This is a constructive bullish look, and these are the types of stocks or ETFs I want to hold. The opposite of bullish alignment is called bearish alignment and that is when the asset is below its downward sloping 10-month EMA. I want to avoid owning those assets.
Chart 2: Monthly VXF with 10-Month EMA
www.stockcharts.com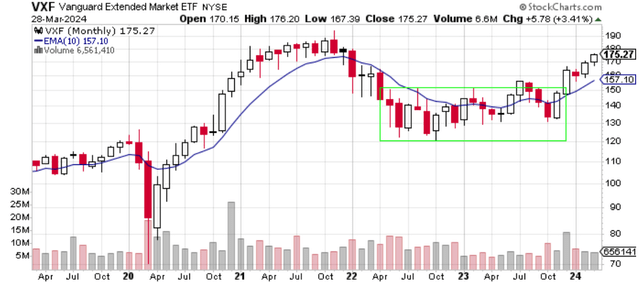
VXF had the best month of the ETFs covered in this article. VXF gained 3.41% in March, and it too is in bullish alignment. VXF is above its upward sloping 10-month EMA. One easy distinction to draw between Chart 1 and Chart 2 is that VXF has not made a new high yet. It looks to be coming soon, but for now VXF, while in bullish alignment, still hasn’t broken out to new highs.
Chart 3: Monthly EFA with 10-Month EMA
www.stockcharts.com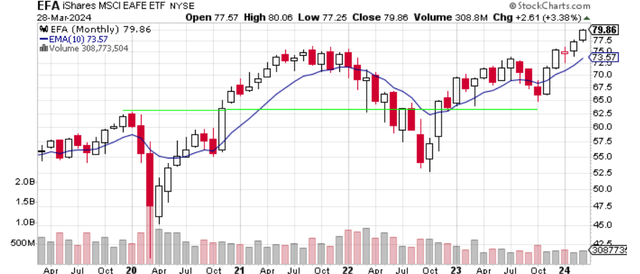
Chart 3 shows that EFA had a good month. It was up 3.38% and closed at a new high. New highs are always bullish for trend followers. EFA has been above the 10-month EMA for 15 of the last 17 months showing a strong upward trend. EFA remains in bullish alignment and the odds favor higher highs in the future.
Chart 4: Monthly AGG with 10-Month EMA
www.stockcharts.com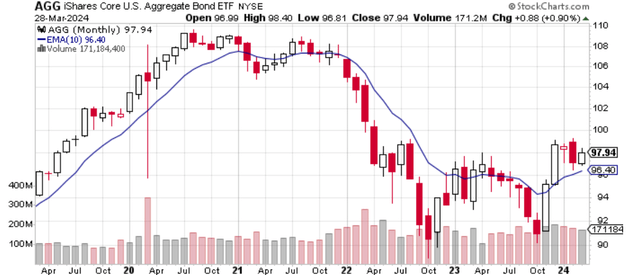
Looking at Chart 4 you can see that AGG is in bullish alignment as well. It gained just under 1% in March. What is encouraging for AGG bulls is that AGG has now been in bullish alignment for five consecutive months. That’s the longest bullish alignment streak for AGG since late 2021. AGG is putting in a series of higher highs and higher lows and the 10-month EMA is trending higher. AGG is saying that interest rates are coming down.
Looking at the first four charts in isolation, I can allocate money to each of these ETFs. They are all in bullish alignment using my methodology of price and the 10-month EMA. Now I will look at the relative strength ratios to determine which of these ETFs I should allocate my money to in April.
Chart 5: Monthly VXF:SPY Relative Strength Ratio with 10-Month EMA
www.stockcharts.com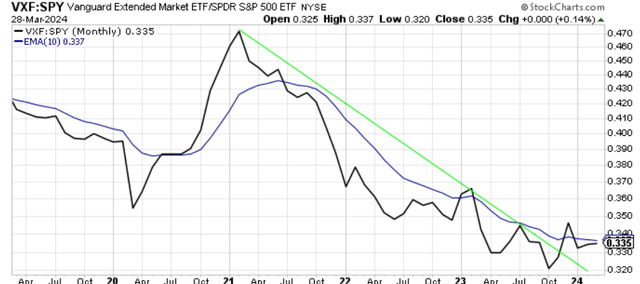
Reading relative strength charts is easy to do. The black line in Chart 5 is the ratio of the price of VXF to SPY. When the black line is declining, that means that VXF is underperforming SPY. When the black line is rising, that means that VXF is outperforming SPY. I use the 10-month EMA in blue the same way as I do in the previous four charts. I want to own an asset that is in bullish alignment. Chart 5 shows that VXF outperformed SPY by 0.14% in March. Despite that success, the VXF:SPY ratio is still in bearish alignment. The ratio is below its downward sloping 10-month EMA. Consequently, I would rather own SPY at this time versus VXF. It does appear that condition will change soon, but I prefer to wait until the chart says that it has occurred. The ratio looks to be putting in a higher low which is bullish. It wouldn’t surprise me to see this ratio in bullish alignment at the end of April. For now, I won’t be allocating money to VXF in April as this ratio still favors SPY.
Chart 6: Monthly EFA:SPY Relative Strength Ratio with 10-Month EMA
www.stockcharts.com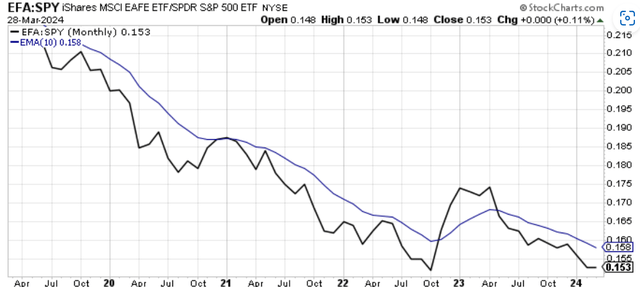
Chart 6 shows that EFA slightly outperformed SPY in March by 0.11%. That outperformance didn’t change the trend, however. The EFA:SPY ratio is still in bearish alignment indicating that I won’t allocate money to EFA in April. On the plus side for this ratio, it looks like the ratio is trying put in a higher low which is how bearish trends change into bullish trends. We’ll have to see how April treats this ratio.
Chart 7: Monthly EFA:VXF Relative Strength Ratio with 10-Month EMA
www.stockcharts.com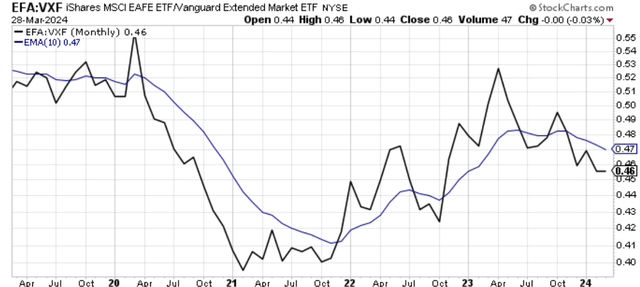
Chart 7 shows that EFA and VXF had about the same performance in April. However, Chart 7 also shows that the trend has been in favor of VXF for the last year. The ratio has put in a series of lower highs and lower lows, the definition of a down trend. The EFA:VXF ratio is in bearish alignment meaning I would allocate money to VXF over EFA at this time if I had to choose between the two ETFs.
Chart 8 – Monthly AGG:SPY Relative Strength Ratio with 10-Month EMA
www.stockcharts.com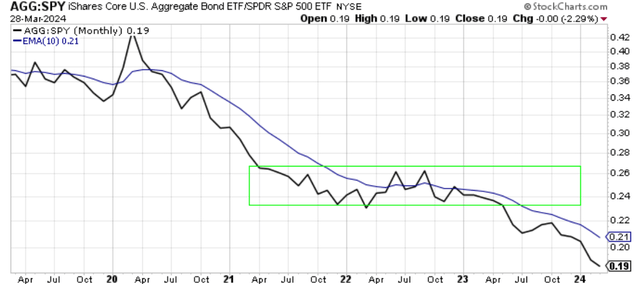
Just like the other charts, AGG by itself is bullish. However, the AGG:SPY ratio chart tells another story. From an opportunity cost perspective, I can’t allocate money to AGG over SPY. Cleary, investors are favoring equities to bonds as Chart 8 made another new low in March.
In summary, Charts 1, 2, 3 and 4 all show the ETFs to be in bullish alignment. Any one of those ETFs meet my minimum requirement for the allocation of my money. They are all above their upward sloping 10-month moving averages. Those are the ETFs I want to own as those are ETFs in uptrends. However, Charts 5, 6, and 8 helped me narrow down the ETF that is both in an uptrend and is outperforming the other ETFs at this time. SPY is ETF that I will allocate 100% of my retirement funds to in the month of April. SPY is in bullish alignment on its own as shown by Chart 1 and is in bullish alignment versus the other ETFs via the relative strength charts shown by Charts 5, 6, and 8. Next month, I will go through the same process and see if I need to make any changes.
Read the full article here


