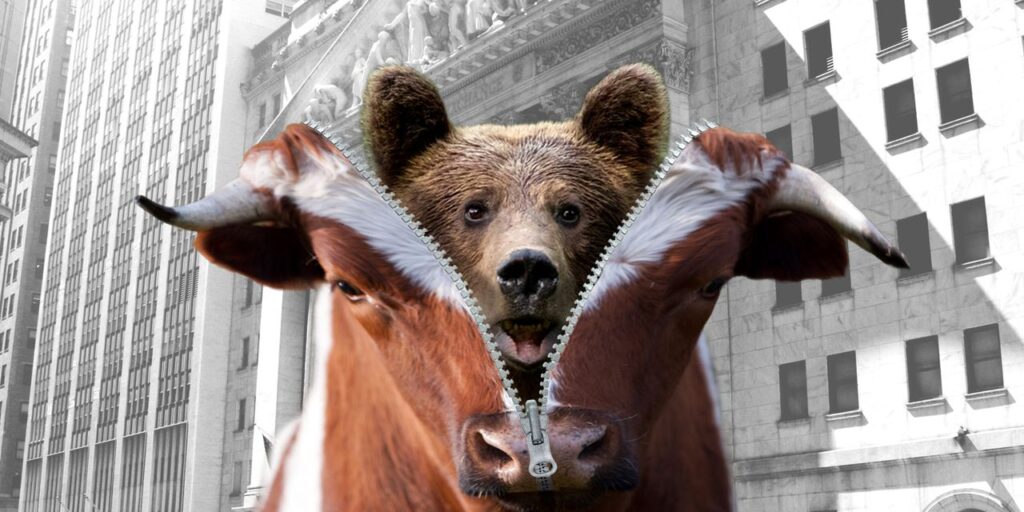
There’s a 40% chance that the stock market’s recent correction will turn into a major bear market.
Last Friday the S&P 500
SPX
entered correction territory by closing more than 10% below its July 31 high. The U.S. benchmark index would have to fall by another 10 percentage points to satisfy the semi-official definition of a bear market.
The 40% odds that it will fall this additional amount have nothing to do with a geopolitical assessment of whether the wars in Ukraine and the Middle East will escalate, inflation and interest rates will stay “higher for longer,” or any of the other factors that currently are causing anxiety on Wall Street. Instead, these odds emerge from a simple analysis of how many S&P 500 corrections of the past century turned into bear markets.
Specifically, I analyzed a database of all S&P 500 declines of at least 10% since 1928. Of the 55 corrections on the list, the stock market in 21 cases (or 40%) eventually fell enough further to eclipse the greater-than-20% decline threshold.
While you may find it unsettling that there’s this high a probability that we’re already in a bear market, you should know that it is not significantly higher than the bear-market odds that exist for any random day. Since 1928, according to a bear-market calendar maintained by Ned Davis Research, 29.9% of all trading days have occurred during a bear market. So the odds we’re currently in a bear market are only modestly higher than they would be at any other time — 40% instead of 29.9%.
Is it possible to torture the data into providing a more definitive prediction? If there is, I couldn’t find it. Various valuation indicators, for example, are largely unhelpful in distinguishing between those declines that turned out to be shallow and which instead morphed into bear markets.
Consider the 33 corrections since 1928 that did not turn into a bear market. The cyclically adjusted price earnings (CAPE) ratio stood at an average of 19.0 at the market highs preceding those corrections. In contrast, the CAPE averaged 21.0 at the highs preceding those corrections that did turn into bear markets. The CAPE stood at 31.5 at the S&P 500’s summer high, which is at the 95th percentile of all monthly CAPE readings since 1881.
“ Large daily gains occur more frequently during bear markets than bull markets. ”
You might wonder if the bear-market odds I have calculated need to be updated in light of the stock market’s explosive rally on Monday this week, in which the Dow Jones Industrial Average
DJIA
soared 511 points, or 1.6%. I don’t think so, but to the extent the odds need to be updated, the odds actually would increase that the correction will morph into a bear market.
That’s because large daily gains occur more frequently during bear markets than bull markets. Of the100 largest daily percentage gains that the S&P 500 has experienced since 1928, 57% of them occurred during bear markets in the NDR calendar, almost double the percentage of all days that occurred during a bear market.
So don’t get carried away. To the extent that you can draw any conclusion from a huge daily gain, it would be that we’re more likely than not in a bear market.
Mark Hulbert is a regular contributor to MarketWatch. His Hulbert Ratings tracks investment newsletters that pay a flat fee to be audited. He can be reached at [email protected]
More: Dow edging closer to bearish ‘death cross’ signal: What it would mean for stocks
Also read: Stanley Druckenmiller slams Janet Yellen for ‘biggest blunder in Treasury history’: Failing to lock in rock-bottom interest rates
Read the full article here
